Get more data out of your solar panels

I wanted to find out how much energy my solar panels produced, how much of it we used in the house and how much we exported/imported with the grid.
Overall I wanted to crunch the numbers on whether it could be cost effective to install a battery at home*.
The method below will apply to most solar panels with an app but the specifics will vary. In my case I am using a myenergi Hub with Zappi EV charger to get my data. I typically access this data through the myenergi app, but short of writing down the figures for each day or week, there's no way to get a bulk export of my own data via the app. So if you're in a similar situation, this is what you'll need to do:
- Find a way to get data out of your system - in my case I found an excellent unoffical API documentation courtesy of twonk on GitHub.
- I made the API request via a visual tool called n8n. You can self host it or pay €20 for n8n.cloud to get started right away.
- I saved the raw data into a google sheet and ran some further analyses using it.
The first point is the most challenging, you will likely have to search GitHub to see if solutions exist. Or you might try Home Assistant and see if an integration exists for your panels software.
*The answer is "not really" on purely economic terms - but perhaps it can be justified on environmental / self sufficiency reasons.
These are the exact steps I followed:
- Understand the API - what is the base URL to query, what are the end points etc. For myenergi/zappi devices it's all laid out here:
 twonk
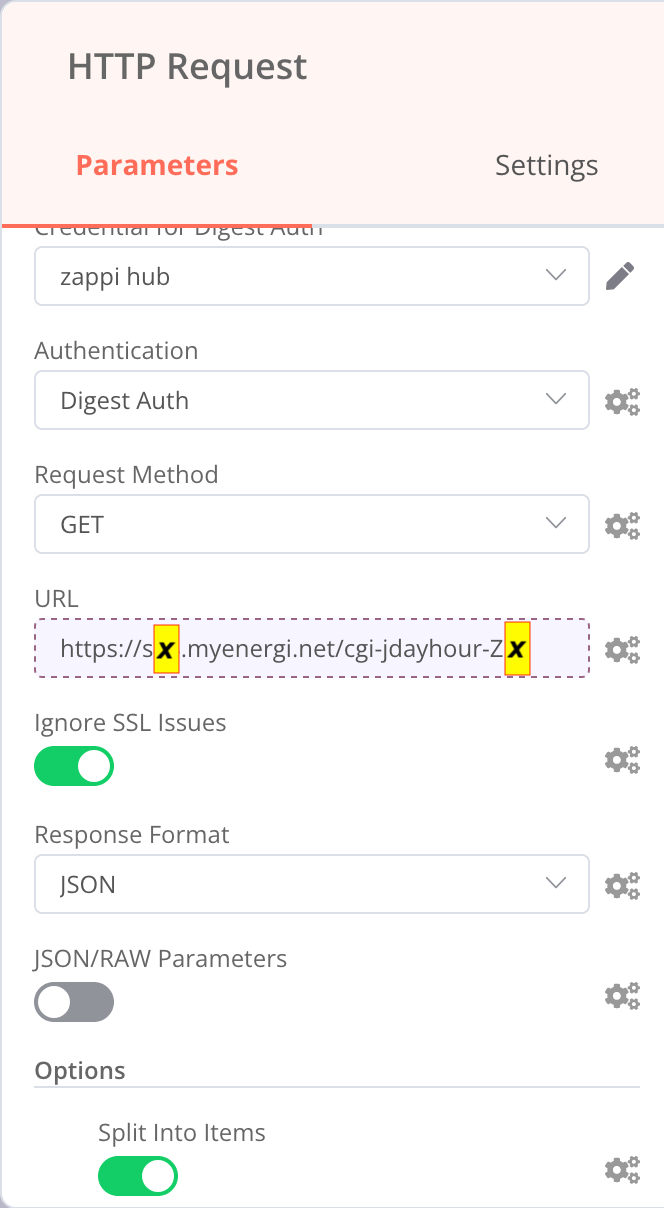
twonk2. You'll need something to make a HTTP Request. For this I used n8n but you could write your own script or use another tool like n8n to make it easier. I configured my HTTP Request node in n8n as shown:
URL:
https://s8.myenergi.net/cgi-jdayhour-Z1111111-{{$node["SplitInBatches"].json["Dates"]}}
The API host is sX.myenergi.net (see twonk's guide for how to figure out your number). We are getting data from the cgi-jdayhour endpoint which returns energy consumption per hour during a given day. The curly brackets are specific for n8n - they allow me to feed in a list of dates from a spreadsheet and make a API request for each individual date in turn. Each request gets me data for one specific day. The day is specified is in the format yyyy-mm-dd.
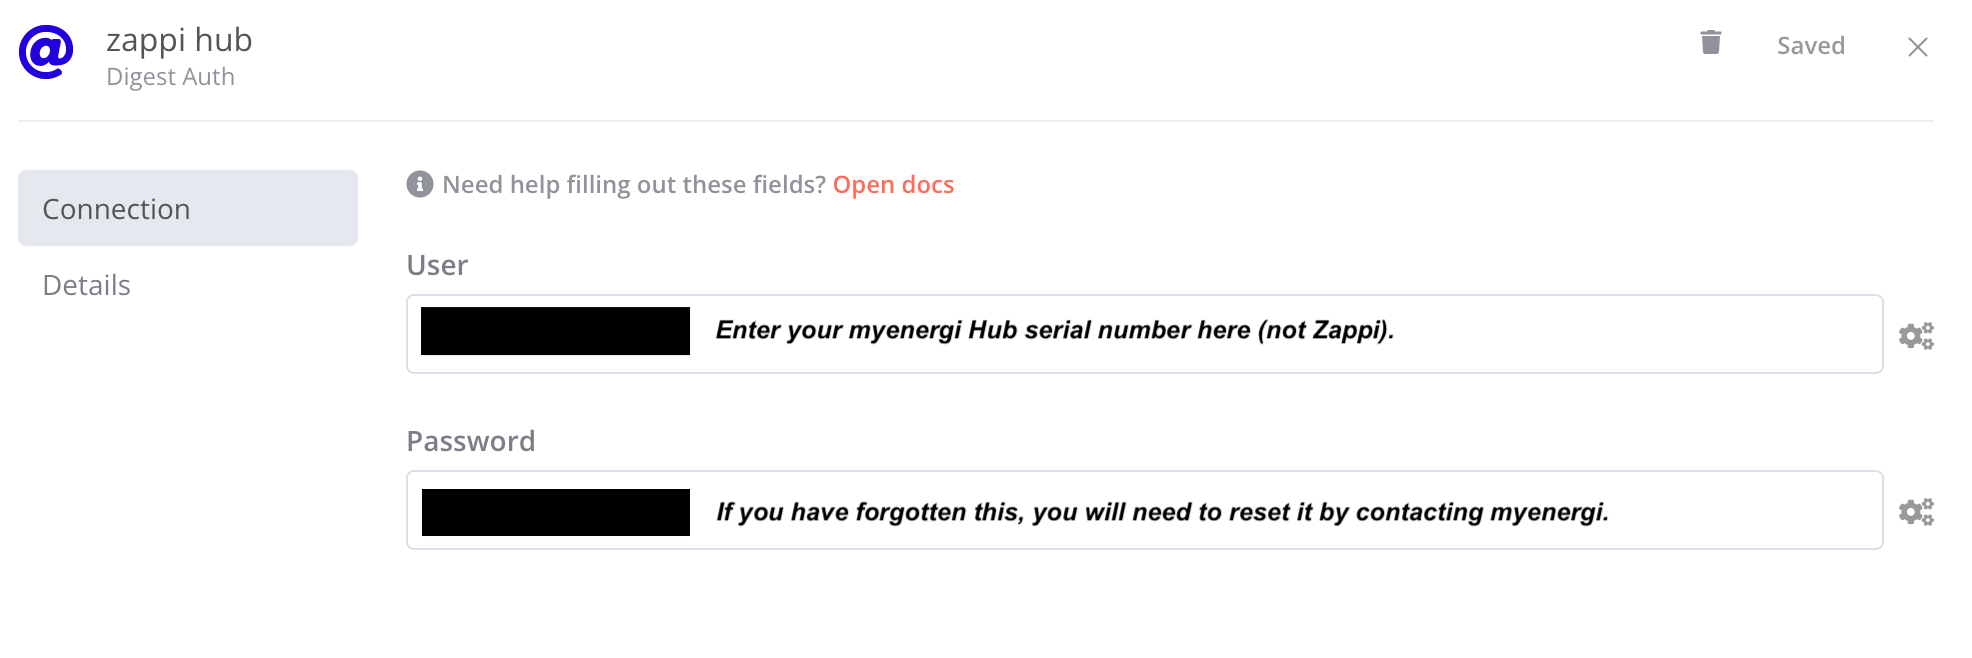
You will also need your Zappi's serial number (not the hub's). So if you want data for 1st Jan 2022, your API host (also called ASN) is s8.myenergi.net and your hub serial number is Z1111111, your URL will look like this:
https://s8.myenergi.net/cgi-jdayhour-Z1111111-2022-1-1
Digest Auth Credentials:
Finally your HTTP node configuration should look like this - don't forget to enable the "Split Into Items" option to output cleaner data. It's found in the "Add Option" dropdown button.
3. We want to make a series of requests - one for each day that we want data for. And that's where n8n is very powerful because it makes it easy and visual. You can use other ways to do this too -- I find n8n works well for me.
You need to structure a workflow that does the following:
- From a list of dates which are in Google Sheets, take each date in turn (this is what the Split In Batches module does).
- Make a HTTP request to the myenergi API using the correct URI structure based on your ASN/URI, Zappi serial number and the date from the first step.
- This returns a long list of data containing the data fields: imp for imported joules per hour, exp for exported joules per hour and gep for "generated positive" joules per hour.
- We need to save these figures (returned on an hourly basis for the day) somewhere we can work with them. In my case, I saved to a Google sheet. gen ("generated negative") can likely be ignored as it's irrelevant data for our purposes. I also saved the h1b and h1d figures in case they come in useful later. 🤷♂️
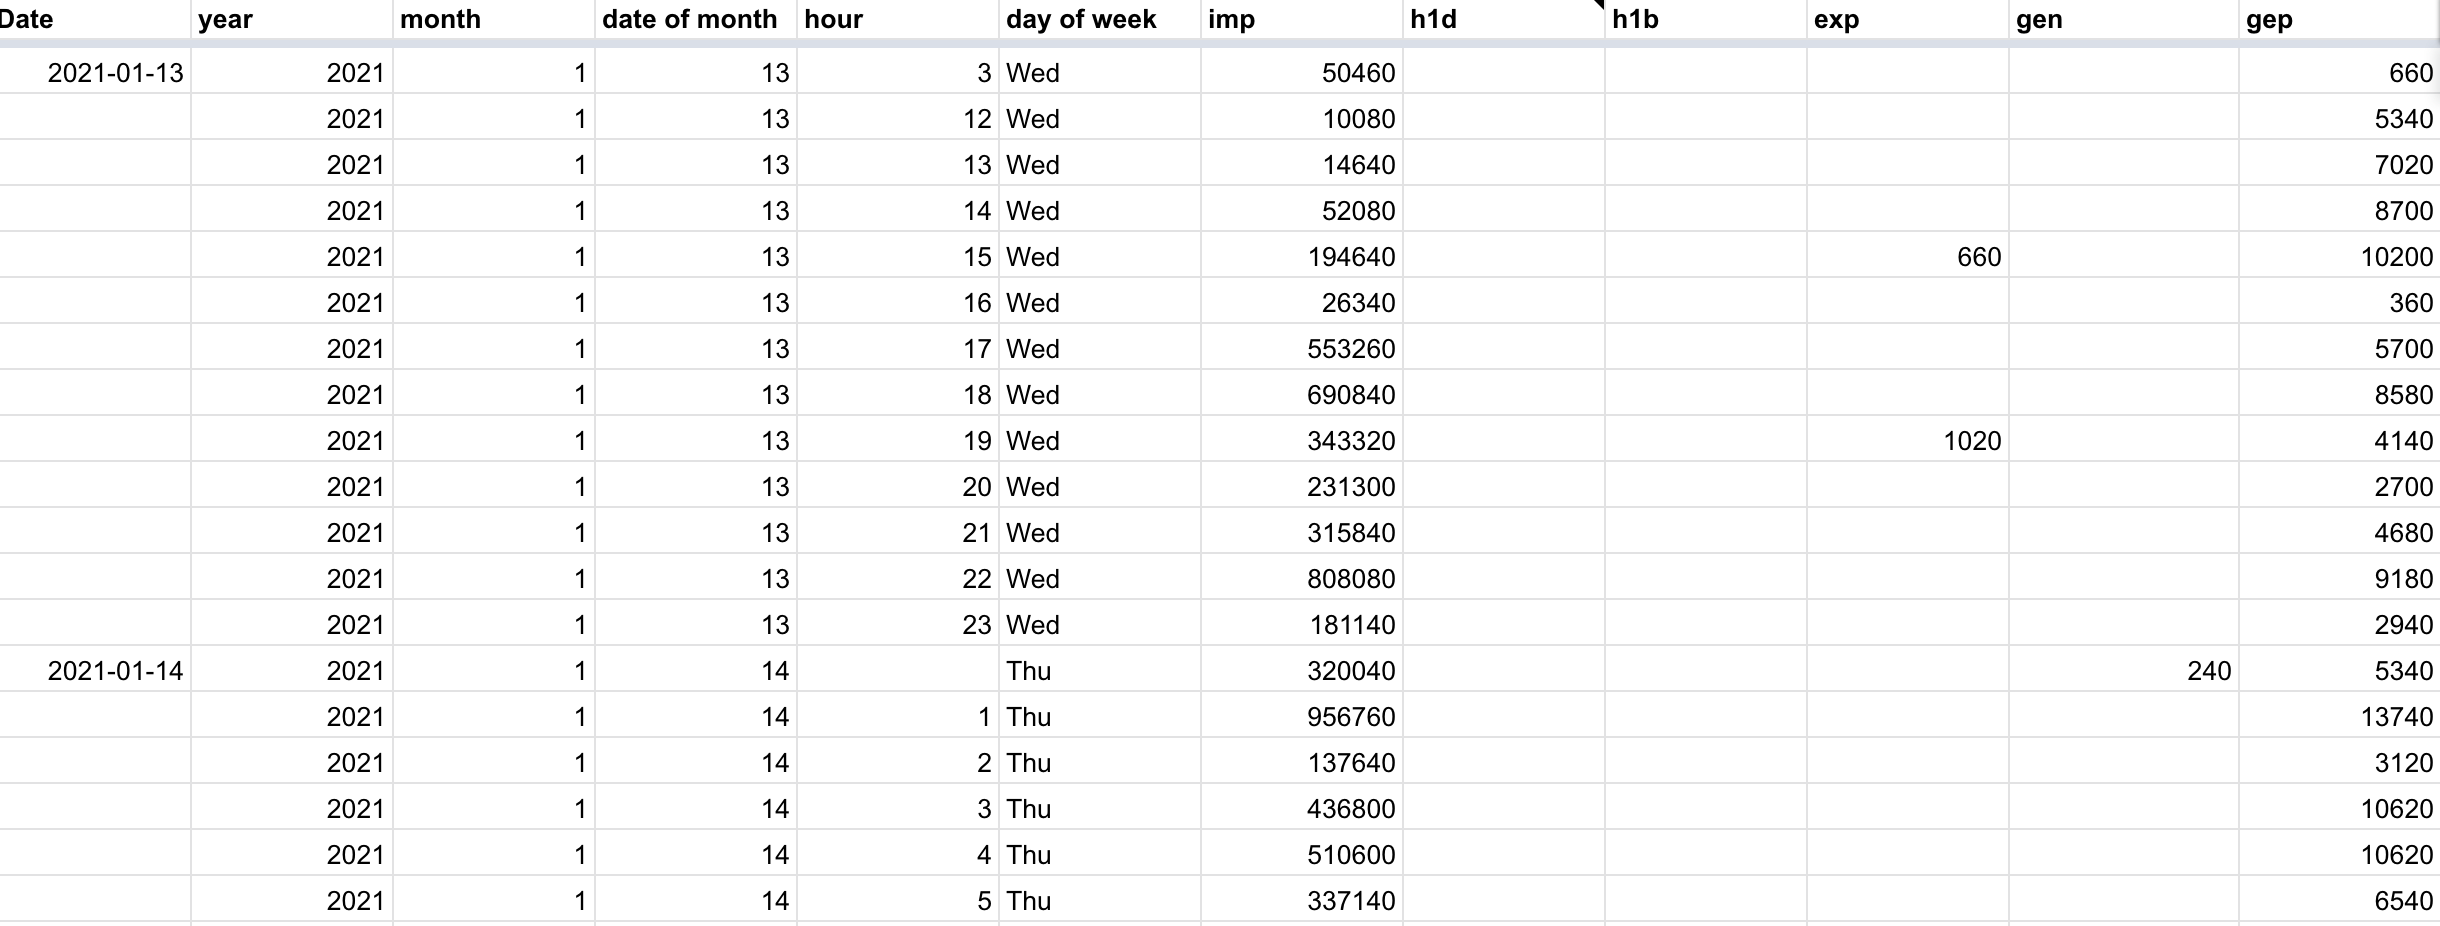
- Let the workflow run for each date you want to retrieve data for. In the end you should have thousands of lines of data. Each day is 24 lines of data so if you wanted to get data for 100 days, you would have 24*100 = 2400 rows of data.
4. Now you have all your raw data in a spreadsheet you can do what you like with it. I wanted to know the following:
- What does my solar generation curve look like throughout the day - i.e. during what hours are my panels making the most/least energy.
- How much of the solar that I generate do I use up?
- During what hours are the biggest surpluses? –> So I can try to run energy hungry appliances during those hours.
- Sense check my annual consumption costs and generation income from feed in tariffs.
All this is quite straightforward in sheets. Leave a comment with specific questions. Otherwise enjoy pretty graphs like this one 👇